The long road ahead.
 For some time now, we have been concerned about the medium-term impact of persistent high unemployment in the US. Not only does unemployment weaken consumer sentiment, it can cause workers’ skills to become obsolete. That is of particular concern in this recession, as aggregate unemployment and the number of long-term unemployed (over six months), remains high. We recently delved into the unemployment statistics to understand the extent of the damage done, get a better sense of how long recovery would take, how unemployment might affect the capital markets, and see how this recession compares to those prior.
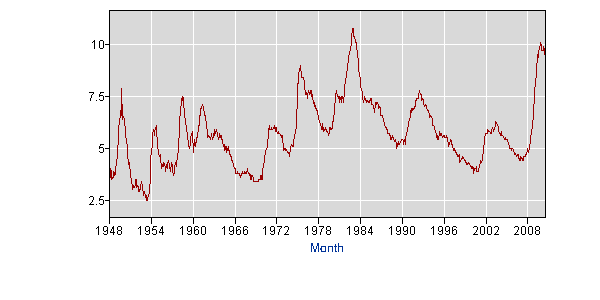
The chart below illustrates what many Americans instinctively feel: that this recession is worse than other post-war recessions. Unemployment is higher than at any point except the ’82-’83 recession. What’s worse, in every other post-war recession, unemployment has fallen rapidly after reaching its peak. But that has not happened in this downturn.
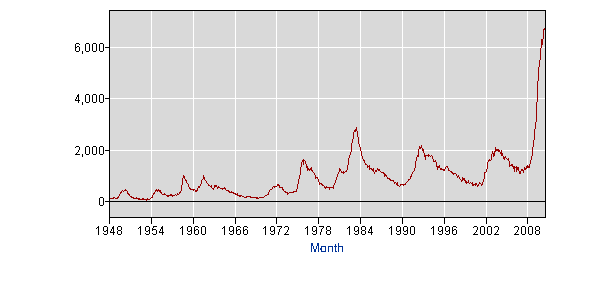
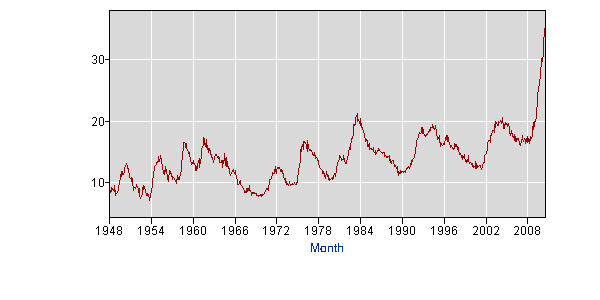
When we consider those who have been looking for work for over 27 weeks (chart below), the situation looks even more dire. Over 6 million Americans have been looking for work for 6 months or more. Long-term unemployment is also at the highest levels it has been in the post-war era as a percentage of unemployed persons or as a percentage of the labor force. In prior recessions, the culprit was largely the normal business cycle. Too many goods were produced during the boom and production had to be cut quickly to bring inventories back in line with reduced demand in the bust. What we are presently facing in the US is a business cycle amplified by a banking crisis and a real-estate bubble. This is a different type of downturn, and it implies a protracted recovery with a lot of painful adjustment for both households and businesses.
This recession has also affected those without higher education much more severely than it has those with college degrees. In prior recessions, workers in manufacturing or construction were laid-off and then quickly re-hired once inventories were depleted and/or demand picked back up. Not this time. The average unemployed worker has been looking for a job far longer than in any other recession since the second world war (over 30 weeks as noted below). Unemployment, particularly for those without a college education, remains stubbornly high. Workers are simply not being re-hired for their old jobs aftr a temporary layoff. Before these workers can re-enter an increasingly service oriented, technology-heavy work environment, many of them will require re-training or additional education.
Long-term unemployment has enormous implications for the credit-worthiness of US households. Households with one member who has been unemployed for over 6 months are extremely stressed financially, and we expect further deterioration in consumer and residential mortgage credit unless unemployment falls dramatically.
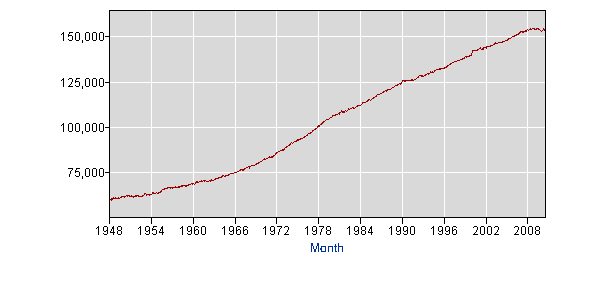
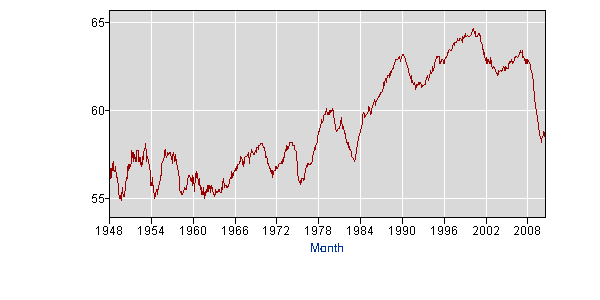
Lets switch gears for a moment and talk about a few facets of the unemployment statistics which are not readily apparent from the headline unemployment number. Headline unemployment only includes those people who are actively looking for work. Those who are not actively seeking work are considered to have dropped out of the labor force or be marginally attached to it. As expected, during this recession, the labor force has contracted as the long-term unemployed are discouraged from looking for work due to repeated disappointment. This contraction is especially remarkable when we consider that the population of 25-65 year olds in the US continues to grow (i.e. this contraction in the labor force is not a result of baby boomers retiring). A labor force that had been increasing by about 100,000 each month now stands exactly where it was 32 months ago, in Jan 2008. Approximately 3 million people are no longer considered to be in the labor force and are not counted in the headline unemployment number. In the graph of the civilian labor force level below, note the remarkable flattening of the curve over the past three years. At some point, these people will start looking for work again. When they do return, their numbers will swell the unemployment rolls and keep the headline unemployment rate high.
Looking at it in another way, the percentage of Americans participating in the labor force and the total percentage employed have fallen more than the unemployment rate has risen. These Americans are presumably being supported by working members of their families. But their involuntary idleness does matter, even if they don’t show up in the headline number. The longer they stay out of the labor force, the more outdated their skills become, and the tougher it becomes to re-integrate them into the work-force. This will impact the nature and duration of any recovery and has structural implications for the US economy.
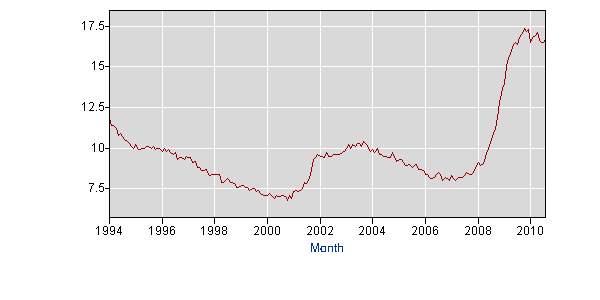
This brings us to U-6, or “Broad Under-Employment” which is the BLS‘s measure of those unemployed, employed part-time (involuntarily) and discouraged workers. Broad unemployment remains stubbornly high at almost 17%. This suggests probably one quarter of all US households are stressed in some way (many households have multiple workers).
In our view, unemployment and labor under-utilization remains the big story three years into the real-estate and banking crisis. We have maintained that any recovery will be slow and require another 3 to 5 years.
There are two primary reasons we have held this view:
Households repairing balance sheets: After an extensive period of borrowing to consume, the average US household is saving and has cut consumption aggressively in an attempt to reduce debt. This is remarkably similar to what happened in Japan a few years after the Japanese real-estate/stock market bubble burst. 20 years later, Japanese households continue to save and skimp. The US does not have the severe demographic contraction that Japan suffers from, nor was the US real-estate bubble as great as the Japanese bubble of the 80s, and the Japanese political environment creates even higher barriers to meaningful adjustment. Keeping this in mind, we do not expect the impact of the recent crisis to be as severe as the lost decades of growth in Japan. Nevertheless, we believe the depth and degree of this recession will affect American attitudes towards consumption and debt for a long time to come. Not unlike the way the Great Depression did for a prior generation.
Structural Change in specific sectors: Over the past two decades, finance and construction employment in the US rose faster than expected, fueled by low interest rates. In our view, a fundamental shift in attitudes towards financial products and real-estate will lead to a permanent reduction in activity within these sectors. Unemployed workers from the Financial Services, Construction and Real-Estate sectors may need to transition to other industries. This will take time, and coupled with the re-entry of part-time and discouraged workers may conspire to keep headline unemployment high for a while.
A risk that we see developing is that political necessity drives government to intervene and support sectors that require painful structural changes before the broader economy is poised for sustainable growth. Emergency measures were taken to support the financial, real-estate and construction sectors, but these do need to be withdrawn. Further support to industries in dire need of restructuring would simply perpetuate the mis-allocation of resources and lead to future crises.