Author: subir

Innovation, jobs and national champions.

Innovation, jobs and national champions.

We noticed an editorial by Andy Grove in Bloomberg a few weeks ago titled How to Make an American Job Before It’s Too Late.  Andy Grove, a founder of Intel, makes a number of very important points in the piece, chief amongst which is the link between production and future innovation.  Mr. Grove makes a powerful case for rethinking outsourcing (at both the corporate and national levels).

Meanwhile, in the Financial Times, Michael Spence wrote an equally strident piece titled America Needs a Growth Strategy.  Mr. Spence highlights the role capital formation (of all sorts) plays in spurring and sustaining future growth. Both authors make the argument that a steady decline in US manufacturing has removed important capital goods, including modern factories and assembly lines, from our economy with potentially dire consequences for innovation, business and eventually politics.  We find the argument that innovation and research cannot occur for long without a close link to production facilities very compelling.

The US case is in stark contrast to China, which, in the past 20 years, has managed to accumulate both capital goods and build the world’s largest manufacturing center.  Mure Dickie writes about how Chinese joint-venture partners emerged as strong competitors to Japanese high-speed rail firms in an article titled Japan Inc Shoots itself in foot on Bullet Train.  Mr. Dickie then followed up on this story with a full length analysis of the global high-speed rail industry, highlighting how Chinese state sponsored companies have “digested” technology from foreign partners and emerged as competitors at all levels, not simply for low value components.  The rapid rise of Chinese firms in industries that have taken decades to develop is neatly encapsulated in the Californian anecdote.  California, in many ways the cradle of modern high-technology, is considering a Chinese firm to build its high-speed corridor between San Francisco and LA. Similar trends have been visible in other clean technology industries, from photo-voltaic panels to high-efficiency batteries.

Which brings us to the curious case of Huawei, the world’s third-largest manufacturer of communications equipment, which has been shut out of the world’s largest market (the US) due to fears about the potential for espionage. Since US-based companies closely linked to the defense industry have been leaders in the communications industry for decades, we wonder whether we’re seeing frenzied jockeying for the prime eavesdropping territory in our newly networked world.  Paul Taylor and Stephanie Kirschgaessner  write about the company in the FT, Huawei in drive to land big US deal, and the Economist covered the company’s meteoric rise last year in Up, up and Huawei.

All this is occurring in the context of increasingly vocal complaints and criticism by senior executives at GE, Microsoft, Google, Siemens and BASF about the business climate in China for foreign firms.

We don’t believe governments are better resource allocators than free markets in general.  But it is difficult to be sanguine about an industrial policy intentionally developed to facilitate the transfer of technology from foreign participants with the goal of weakening them.  Technology is not a traditional resource, it is difficult and expensive to develop, but easy to copy and reuse.  We know that an industrial policy designed to accumulate a resource like iron ore or oil will drive up prices and be counter-productive.  But it seems to us that “digesting” technology while purchasing implementations has few ill-effects we can see.  That said, legal protections for intellectual property were developed with this in mind. Intellectual property rights are notoriously difficult to enforce within China’s opaque, arbitrary and unequal legal system, but we will be interested in following the intellectual property cases that arise when Chinese technology firms begin to compete for contracts in the global marketplace.

The long road ahead.

The long road ahead.

For some time now, we have been concerned about the medium-term impact of persistent high unemployment in the US.  Not only does unemployment weaken consumer sentiment, it can cause workers’ skills to become obsolete.  That is of particular concern in this recession, as aggregate unemployment and the number of long-term unemployed (over six months), remains high.  We recently delved into the unemployment statistics to understand the extent of the damage done, get a better sense of how long recovery would take, how unemployment might affect the capital markets, and see how this recession compares to those prior.

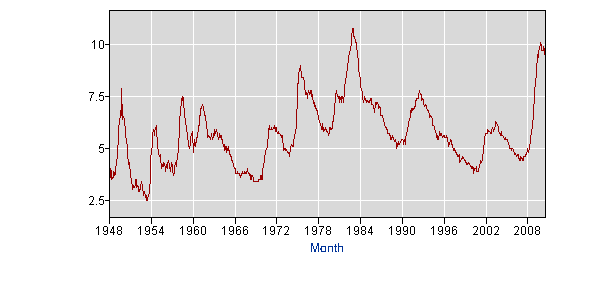
The chart below illustrates what many Americans instinctively feel: that this recession is worse than other post-war recessions.  Unemployment is higher than at any point except the ’82-’83 recession.  What’s worse, in every other post-war recession, unemployment has fallen rapidly after reaching its peak. But that has not happened in this downturn.

Unemployment Rate (Seasonally Adjusted)

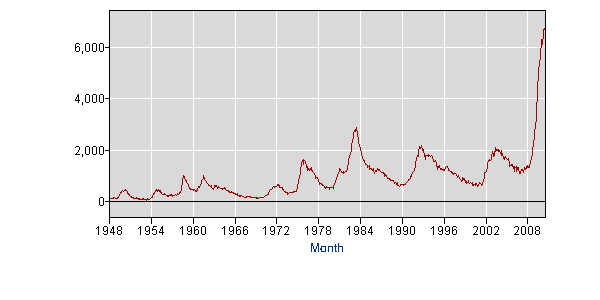
When we consider those who have been looking for work for over 27 weeks (chart below), the situation looks even more dire. Over 6 million Americans have been looking for work for 6 months or more.  Long-term unemployment is also at the highest levels it has been in the post-war era as a percentage of unemployed persons or as a percentage of the labor force.  In prior recessions, the culprit was largely the normal business cycle.  Too many goods were produced during the boom and production had to be cut quickly to bring inventories back in line with reduced demand in the bust.  What we are presently facing in the US is a business cycle amplified by a banking crisis and a real-estate bubble.  This is a different type of downturn, and it implies a protracted recovery with a lot of painful adjustment for both households and businesses.

Number of Unemployed (over 27 weeks)

This recession has also affected those without higher education much more severely than it has those with college degrees. In prior recessions, workers in manufacturing or construction were laid-off and then quickly re-hired once inventories were depleted and/or demand picked back up.  Not this time.  The average unemployed worker has been looking for a job far longer than in any other recession since the second world war (over 30 weeks as noted below).  Unemployment, particularly for those without a college education, remains stubbornly high. Workers are simply not being re-hired for their old jobs aftr a temporary layoff.  Before these workers can re-enter an increasingly service oriented, technology-heavy work environment, many of them will require re-training or additional education.

Average Weeks Unemployed (Seasonally Adjusted)

Long-term unemployment has enormous implications for the credit-worthiness of US households. Households with one member who has been unemployed for over 6 months are extremely stressed financially, and we expect further deterioration in consumer and residential mortgage credit unless unemployment falls dramatically.

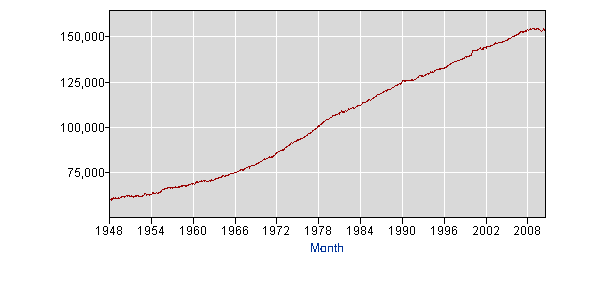
Lets switch gears for a moment and talk about a few facets of the unemployment statistics which are not readily apparent from the headline unemployment number. Headline unemployment only includes those people who are actively looking for work. Those who are not actively seeking work are considered to have dropped out of the labor force or be marginally attached to it. As expected, during this recession, the labor force has contracted as the long-term unemployed are discouraged from looking for work due to repeated disappointment. This contraction is especially remarkable when we consider that the population of 25-65 year olds in the US continues to grow (i.e. this contraction in the labor force is not a result of baby boomers retiring). A labor force that had been increasing by about 100,000 each month now stands exactly where it was 32 months ago, in Jan 2008. Approximately 3 million people are no longer considered to be in the labor force and are not counted in the headline unemployment number.  In the graph of the civilian labor force level below, note the remarkable flattening of the curve over the past three years.  At some point, these people will start looking for work again.  When they do return, their numbers will swell the unemployment rolls and keep the headline unemployment rate high.

Civilian Labor Force Level (Seasonally Adjusted)

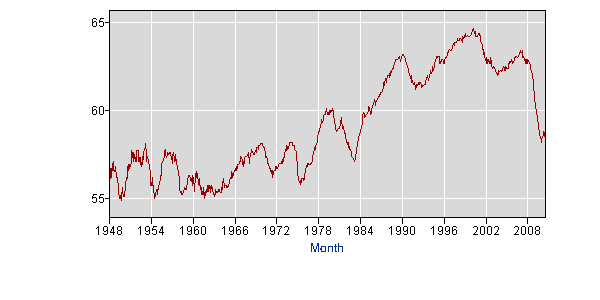
Looking at it in another way, the percentage of Americans participating in the labor force and the total percentage employed have fallen more than the unemployment rate has risen. These Americans are presumably being supported by working members of their families. But their involuntary idleness does matter, even if they don’t show up in the headline number. The longer they stay out of the labor force, the more outdated their skills become, and the tougher it becomes to re-integrate them into the work-force.  This will impact the nature and duration of any recovery and has structural implications for the US economy.

Employment - Population Ratio (Seasonally Adjusted)

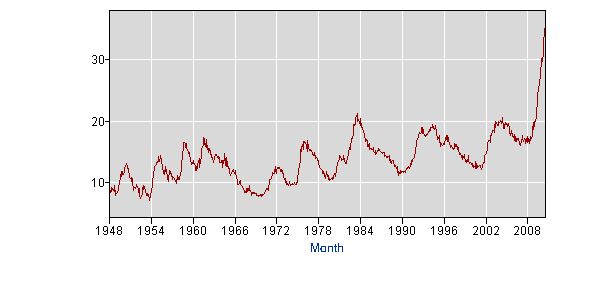
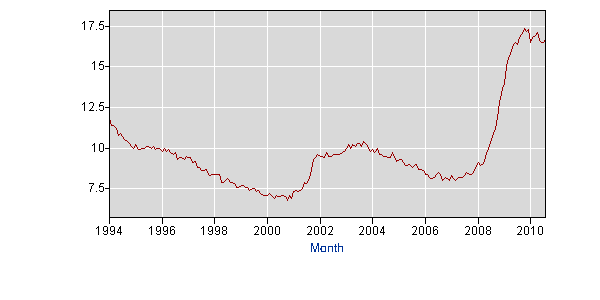
This brings us to U-6, or “Broad Under-Employment” which is the BLS‘s measure of those unemployed, employed part-time (involuntarily) and discouraged workers. Broad unemployment remains stubbornly high at almost 17%.  This suggests probably one quarter of all US households are stressed in some way (many households have multiple workers).

Broad Unemployment and Under-Employment, U-6 (Seasonally Adjusted)

In our view, unemployment and labor under-utilization remains the big story three years into the real-estate and banking crisis. We have maintained that any recovery will be slow and require another 3 to 5 years.

There are two primary reasons we have held this view:

Households repairing balance sheets: After an extensive period of borrowing to consume, the average US household is saving and has cut consumption aggressively in an attempt to reduce debt. This is remarkably similar to what happened in Japan a few years after the Japanese real-estate/stock market bubble burst.  20 years later, Japanese households continue to save and skimp.  The US does not have the severe demographic contraction that Japan suffers from, nor was the US real-estate bubble as great as the Japanese bubble of the 80s, and the Japanese political environment creates even higher barriers to meaningful adjustment.   Keeping this in mind, we do not expect the impact of the recent crisis to be as severe as the lost decades of growth in Japan.  Nevertheless, we believe the depth and degree of this recession will affect American attitudes towards consumption and debt for a long time to come.  Not unlike the way the Great Depression did for a prior generation.

Structural Change in specific sectors: Over the past two decades, finance and construction employment in the US rose faster than expected, fueled by low interest rates. In our view, a fundamental shift in attitudes towards financial products and real-estate will lead to a permanent reduction in activity within these sectors. Unemployed workers from the Financial Services, Construction and Real-Estate sectors may need to transition to other industries. This will take time, and coupled with the re-entry of part-time and discouraged workers may conspire to keep headline unemployment high for a while.

A risk that we see developing is that political necessity drives government to intervene and support sectors that require painful structural changes before the broader economy is poised for sustainable growth. Emergency measures were taken to support the financial, real-estate and construction sectors, but these do need to be withdrawn. Further support to industries in dire need of restructuring would simply perpetuate the mis-allocation of resources and lead to future crises.

New solar thermal plant in Mojave

New solar thermal plant in Mojave

The Mojave desert boasts some of the largest utility-scale solar power facilities in the world and it will soon get another one.  This week, the California Energy Commission approved the licenses required to begin construction on the Blythe solar power project.  When the facility’s four phases are online, it will generate 1,000 MW making it the 15th largest power plant in California.  The facility will produce roughly the same amount of power as a large-sized coal or gas facility and would be capable of powering 800,000 homes.

The size of the project is definitely attracting attention, and will go a long way towards California’s stated objective of meeting 33% of its power needs from renewable sources by 2020.  The Energy commission is currently reviewing a number of other solar thermal power projects which would add another 3,300 MW in total power generation capacity.

If built, the Blythe plant would be one of the largest solar power projects in the world, but still a drop in the bucket for US power consumption which averaged 420,000 MW per hour in 2009.

Lest we forget, solar projects do have an environmental impact, just as hydro-electric projects do.  This particular project would cover 7,000 acres of flat desert.   The New York Times Green Blog covered the story as well.

Finally, a grown-up discussion about US debt

Finally, a grown-up discussion about US debt

In our view, the biggest financial market story of 2010 has been the unfolding sovereign debt crisis. The crisis started with Iceland and Greece, moved on to Ireland Spain and Portugal and is now approaching American shores.  It’s fitting that the debate should shift to the US, since in many ways a debt crisis in the US would have far graver implications than that in any other nation.

It is not simply that the numbers are bigger, and they are — our USD 1.4 Trillion deficit (the amount the government spends over the amount it collects in taxes) is larger than the GDP of all except a handful of nations. Part of the problem is that the US has been funding two wars without raising additional revenue.  In fact, tax rates were reduced in the early 2000s, and the cost of the wars was taken off the official budget and funded through emergency spending bills.  The US has also spent a great deal over the past two years to stabilize the financial system and broader economy.

But a larger problem looms in the years to come as record numbers of American workers (the baby-boom generation) retire and begin to draw on the Social Security and Medicare benefits they have been promised.  The cost of the benefits has never been fully funded, largely because it has always been in a politician’s self-interest to promise benefits and defer the costs.  In a similar way, special interest groups including health care providers, insurers and drug companies have  followed their own self-interest and grown a health-care system that delivers the most expensive care in the world, with mediocre results.

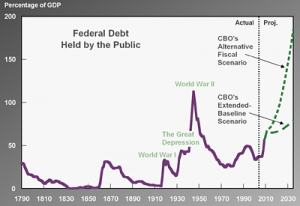
Earlier this week, the Congressional Budget Office published a report on the Federal Budget and The Risk of a Fiscal Crisis which contains a litany of alarming statistics.  The bare facts are that the US government spends more on programs for its citizens than it charges them in the form to taxes.  It has been doing this for decades, and financing the spending with debt, except for a brief period of surplus in the 90s.  This debt now totals USD 13 Trillion and it can only be repaid through tax revenues.  Either income and other tax rates go up, or spending comes down.

The problems seems so intractable, the political views so entrenched, and the distrust so pervasive, that it is difficult to know where to begin.  David Stockman’s Op-Ed in the NYTimes earlier this week makes an excellent start and is well worth the read.  He has also been making the rounds on TV, and there is an excellent interview on Bloomberg well worth watching:

We agree with Mr. Stockman that bringing the US deficit, and by extension the debt, under control will require increasing revenue and controlling spending.  We also agree that the problem has been nurtured and grown under both political parties, and in fact the Republicans may have more to answer for than the Democrats since they have presented a policy of revenue/tax reduction without bringing spending under control.

Mr. Stockman was partly responding to an Op-Ed in the Wall Street Journal by Arthur Laffer (another Reagan adviser).  In his piece, Mr. Laffer argues that lower taxes will spur investment and growth, raising revenues in the process, while raising taxes would do the inverse.  We find two aspects of Mr. Laffer’s  argument misleading.  Raising taxes from 33% to 36% is a very different proposition from raising them if they are already at 60% (as they were in the 1980s). Secondly, the top 1% of earners now pay a higher portion of GDP in taxes is because their share of GDP has grown while that of the rest of the population has stagnated. Extreme income inequality ultimately leads to a breakdown in the social contract. It is also important to remember that the Bush tax-cuts were implemented at a time when the US federal budget was running a surplus.  Sunset provisions were incorporated into the cuts because there was a concern that the

However, the political environment is extremely polarized and it is hard for us to imagine reasonable measures being undertaken prior to the mid-term election.  In our view, all legislative action between now and November 6th will be driven by its impact on congressional races.

The flip side of the debate on taxes revenue is the impact on spending and infrastructure.  Paul Krugman writes about this in the NY Times this weekend.

The immediate question is whether the temporary tax cuts enacted in 2000 are to be extended.  These cuts had a sunset provision embedded in them and were enacted at the height of the tech boom, when revenues were inflated and the US was running substantial fiscal surpluses.  Soon after they were passed, the tech-wreck of 2001-2002 and the events of 9/11 shrank US growth and we have seen deficits rise steadily.  The financial crisis and its aftermath have simply exacerbated a problem that was already quite severe.

In our view, the responsible course of action is to let the temporary Bush-era tax cuts expire.  They will result in small increases  to the federal income rates for most taxpayers, and they are a small step towards tackling the larger problem which is explaining to the American populace that the generous benefits they enjoy must be paid for and we may as well start now since we have been incurring the costs for a while.

As for the timing of any further tax increases, we believe they must be delayed. The US economy will experience the withdrawal of extraordinary fiscal stimulus and expansionary monetary policy over the next two years.  Raising taxes simultaneously could well stall or reverse any recovery.  However, there must be some commitment to simplifying the tax code and progress towards a balanced budget.  Ideally, we would like to see Congress debate and pass a tax reform and increase bill which would take effect in a phased manner over a number of years, with a clear goal of paying down the extraordinary debt the US has accumulated.  If the governing classes in the country don’t have the backbone to deliver this unpleasant medicine now, we may be forced to swallow an even worse pill down the road, much like Greece is today.

This week’s reading

This week’s reading

Below are links to an article, pod cast and blog post we found interesting this week.

In his article Banking Needs More Robust Stress Tests Than These, John Kay writes in the Financial Times about the inadequacy of the European Bank stress tests.  He argues that while the language of “stress tests” is borrowed from engineering, the standards being applied are nowhere near as rigorous as those demanded in engineering.  As many banks learned first hand in 2008,  “industry-standard” stress assumptions can create complacency.  Wimpy standards blessed by primary regulators may be worse.

One of our favorite weekly radio programs/podcasts is This American Life.  The show does not generally cover finance, but does a remarkable job whenever it gets around to covering the topic.  For example, they present a very good explanation of the financial crisis in an episode titled The Giant Pool of Money.  In a recent episode, the team took a look at US state budget deficits through the unique mix of political dysfunction, profligacy and entrenched distrust that characterizes the politics of Albany.  The episode also contained a cautionary tale for states and countries with polarized political landscapes.  In what comes as close to a controlled experiment in economics as one gets, we have the tale of Barbados and Jamaica.  Both countries confronted a ruinous economic landscape in the late 70s.  The nature of their local politics and the level of social cohesion led to small difference in the way they tackled their crises, but these small differences appear to have had an out-sized impact on future growth.   The episode is titled Social Contract, and is worth listening to in its entirety.

and apropos of nothing in particular, we quote The Epicurean Dealmaker:

There are those who style themselves intellectuals—a notably large portion of whom, in my personal experience, happen to be economists—who are deeply suspicious of anecdotal data in general and anecdotes about finance, economics, and the behavior of market participants in particular. This has always struck me as revealing both a superficially shallow skepticism about the primary sense and experience data of others—which, after all, is the most reliable data each of us individually possesses—and a similarly unwarranted credulity about its opposite, broad and impersonal third party datasets.


Oh, and by the way, while quality has certainly improved since I started in investment banking 20 years ago, it remains true, for example, that the banker who wishes to remain employed will always check the accuracy of third party data against original sources before he incorporates it into his own work product. So much for the reliability of external datasets when real money—as opposed to, let’s say, a research grant—is on the line. Oh snap.

— TED, unpublished remarks

Banks and Real-Estate (yes, again).

Banks and Real-Estate (yes, again).

A couple of news articles on the topic of China caught our attention last week.  In an article titled Cooling Property Market Tests Beijing’s Nerves, the Financial Times reported on the sudden, marked slowdown in apartment sales within mainland China and the potential government response to this phenomenon.  What stood out amongst all the anecdotal information is that apartment prices in Tongzhou (a suburb of Beijing) are currently hovering around USD $3,500 per sq. meter (or USD $325 per sq. ft.), perhaps more if you consider the CNY (Chinese Yuan or Renmindi) is undervalued to the USD.  We admit that we’ve never visited China, so we don’t have firsthand knowledge of real estate market trends in Tongzhou (it could be the Greenwich of Beijing for all we know, and in fact, it looks like a pretty nice place from space).  We also readily admit that we aren’t experts when it comes to navigating the complexities of the Hukou system of permits.  Perhaps Tongzhou is the recipient of pent-up demand from people who cannot buy apartments within Beijing proper.  Still, we think $325 per square foot is a bit high, especially when you consider the real estate market in suburban New York (the wealthiest city in the wealthiest nation in the world).   We conducted a quick (completely unscientific) analysis of the property market by looking for new developments in the NYC suburbs (accepting at face value sq. ft. area claims made by the developer).  We end up with asking prices in the range of $250-400 per sq. ft. (across the river in Jersey), $400-600 per sq. ft. (in Brooklyn and Queens) and $250-400 (Westchester).  Median household income in New York City (2008) was $56,000.  Beijing’s statistical bureau doesn’t publish median household income, but they do say that in 2009, disposable income per capita was CNY 26, 700 (USD $4,000).   By our estimate, that puts median household income around USD $12,000-15,000, or 20-25% of that in New York.  Yet prices are roughly comparable.   In our view, these levels are unsustainable and highlight the growing disparity between real estate prices and what Chinese citizens can reasonably be expected to pay for these properties.

Last week also saw the IPO of the Agricultural Bank of China (ABC), the last of China’s major state-owned banks to go public.  Like all the other state-owned banks, ABC spun-off a package of bad loans prior to going public.  What we’re wondering is whether they’ve also spun-off all the employees who made those bad loans (over 10% of ABC’s USD 828 Bn balance sheet at end 2007).  We’re also wondering it is possible to make USD $110 billion in bad loans in an economy that is growing at a 10% clip.  Fitch Ratings has some ideas.

2010 Q2 client letter

2010 Q2 client letter

We hope your summer is going well.

Now that we’ve reached the mid-point of 2010, we thought this would be a good time to look back at our list of Top 10 Themes for 2010 and see how our predictions have fared. We’ve attached this list with an assessment of each of our calls.

Like the recent quarters that have preceded it, the second quarter of 2010 was very eventful.  On April 16th, the SEC dropped a bombshell when it filed a civil lawsuit against Goldman Sachs charging the firm with fraud over its marketing of a 2007 subprime mortgage product known as ABACUS.  The lawsuit shocked many in the financial services industry as it demonstrated the SEC was getting serious (though many have argued too little too late) about holding the larger firms accountable for questionable business practices that helped accelerate the subprime meltdown.  As a result, Goldman’s reputation has taken a major hit and the firm’s share price has fallen over 30% since the lawsuit was first announced.  The lawsuit helped set the stage for the financial reform bill now working its way through Congress.  And while the White House and Congress have repeatedly denied any knowledge of the SEC’s lawsuit prior to its announcement, the timing of the suit certainly didn’t hurt the bill’s chances of being passed.

On April 20th, an explosion on the Deep Horizon oil rig in the Gulf of Mexico destroyed the platform, killed 11 workers and ruptured a riser pipe on the ocean floor that continues to leak oil and gas into the Gulf of Mexico as of this writing.  While initial reports downplayed the severity and extent of the leak, the world quickly learned how devastating this disaster would become after several attempts to staunch the flow failed.  The only viable solution now appears to be the two relief wells BP is digging, which are still several weeks from completion.  The spill, which is now the largest ever to originate in US waters, will no doubt have long term environmental and economic consequences for the gulf region.  In the short term, we will likely see the spill become a focal point for the coming energy bill as well as the November mid-term elections.

May 6th marked the day of the now infamous Flash Crash.  At approximately 2:45 pm, the Dow Jones Industrial Average lost over 700 points in a matter of minutes, only to regain those losses several minutes later.   At one point, the Dow was down 998.5 points, which represented the largest intraday point decline in history and temporarily wiped out over $1 trillion in market value.  The cause of the crash has been vigorously debated, but many agree the central problem was an issue of liquidity (traders willing to buy and sell stock in quantity at the prevailing price).  Today, much of the stock market liquidity is provided by high-frequency traders (HFTs) – computer-driven algorithms used by firms trading at speeds measured in the millionth of a second.  While these HFTs provide liquidity during most normal market conditions, they are not always required to participate in the market (their primary objective is to turn a profit, not to maintain orderly markets). Many critics have suggested that something like the flash crash could occur if a group of these HFTs stop trading simultaneously.  The SEC has since instituted system-wide trading curbs or “circuit breakers” on any S&P 500 stock that rises or falls more than 10% in a five minute period.  It remains to be seen whether or not these measures will prevent another Flash Crash.

In addition to the above the highlights, the quarter also saw a further deterioration in the European sovereign debt crisis, a sustained correction in global equity markets and a some less than stellar economic data from China.

But not all the news is bad!

On a personal note, this past quarter also marked the first year anniversary of Washington Square Capital Management (on May 15th).  This past year has been memorable (to say the least) and we wanted to thank you again for your commitment to work with us – we recognize that none of this would have been possible without you.

Memorial Day Weekend also marked the marriage of Subir to Molly Barker.  There were two weddings: an Episcopal service held on Friday May 28th in New York City and a Sikh service held in Glen Cove, NY on Sunday May 30th.

We look forward to speaking with you during our quarterly review.

10 Economic Themes for 2010: Mid-Year Review

10 Economic Themes for 2010: Mid-Year Review

Mid-year review of our 10 themes for ’10
  1. We expect to see the US unemployment rate to peak at 11% in 2010. We may have been a bit aggressive with this call.  While the US job market remains anemic, the unemployment rate now stands at 9.5% (the lowest all year), partly because of workers who have dropped out of the labor force (stopped looking for jobs).  A falling unemployment rate would normally be encouraging news, but private sector job-creation continues to be very slow, despite the record amount of stimulus that has been pumped into the economy. In addition, the most recent jobs data has been disappointing, so the looming threat of a “double-dip” recession remains high and 11% unemployment later in the year is not out of the question.
  2. Investors will continue to re-allocate towards less volatile investment classes, like bonds in 2010. This scenario has been playing out as we expected.  According to ICI[1], only $7.82 billion in new money has been invested into equity funds through June 23rd 2010, while bond funds have seen $154.35 billion of net inflows.  Over the last eight weeks (where we’ve seen equity markets correct), net inflows into stock funds have been -$31.29 billion, while bond funds have seen +$33.98 billion over that same period.  We continue to believe demographic factors in the US and Europe as well as an increasing wariness towards stocks after two major bubbles in 10 years will lead investors to allocate larger portions of their portfolios to fixed income investments with a higher claim on corporate cash-flow than stocks.
  3. We expect a number of credit downgrades for developed nations as their persistent deficits come into focus.  The US Dollar will strengthen in any ensuing flight to safety. This prediction has been right.  Since the start of 2010, we’ve seen credit downgrades to Greece, Portugal and Spain, as well as a massive bailout plan for Greece.  The US dollar started 2010 valued at 1.4323 per Euro, but strengthened as the situation in Europe deteriorated.  It reached a level of 1.1875 per Euro on June 6th and has recently bounced back to the 1.25 range.  We expect continued pressure on the Euro until a workable solution for the sovereign debt crisis has been reached.
  4. Interest rates will remain effectively at 0% until the 4th quarter of 2010, where we will expect to see the Fed raise rates to the 1-2% range. So far this prediction has been accurate.  The Fed has kept the fed funds rate at historically low levels.  It remains to be seen whether or not the Fed opts to raise rates in the 3rd or 4th quarters.  While most commentators believe the latest round of economic statistics have made a hike unlikely until 2011, we still believe there’s a good chance the Fed raises rates to the 1-2% level after the mid-term elections in Q4 2010 and then pauses for an extended period.
  5. Continuing the trend from 2009, paying down debt will remain the highest priority for US consumers as they attempt to get their financial houses in order. This trend appears to be holding up.  In May, the personal savings rate reached 4%, which is the highest level it has been in 8 months and a far cry from the .8% we saw in April 2008.  Outstanding consumer revolving debt also continues to decline.   The most recent data from the Fed (for April) shows revolving debt at $838 billion, which is down from $866 billion at the start of 2010 and $958 billion at the start of 2009.
  6. The US economy will see almost negligible growth for 2010. It’s a bit early for this call since we won’t see this year’s GDP data until 2011.  Current GDP estimates are on track for 3% growth in 2010.  The caveat, of course, is that this has been accomplished with record government stimulus.  If the economy is unable to stand on its own without the crutch of stimulus, it’s entirely possible the second-half will be much weaker.
  7. Corporations will increasingly turn to mergers and acquisitions to grow market share. This prediction could go either way.  According to the NY Times, the first half of 2010 has seen $810.3 billion in global mergers and acquisitions.  Through the same period in 2009, this number was $814.6 billion.  However, many of the 2009 deals were a result of government activity in the banking sector, whereas 2010 has seen deals taking place across a range of industries.  A recent Ernst & Young study of more than 800 senior executives across the world showed that 57% of businesses surveyed said they are likely to acquire other companies in the next 12 months.  This number was 33% in the last survey (in November of 2009).  Whether or not these executives follow through on this sentiment remains to be seen.
  8. Growth in emerging markets will continue to outpace developed economies.  But this will not be enough to offset the stagnation in developed economies or lead to a robust global recovery. This trend appears to be holding up in 2010.  After a year of gaudy returns, the global equity rally faded in the second quarter.  As of June 30th, the MSCI emerging markets index was -7.22% year to date, the MSCI EAFE index (which tracks developed markets in Europe, Australasia and the Far East) was -14.72% year to date and the S&P 500 was -7.57%.  We continue to believe equity market returns across the world will be negative in 2010.
  9. We believe there is continued risk for a massive correction in China. While we have not yet seen a “massive” correction in China, the Shanghai composite index is now at a 15 month low and is down over 25% through the end of Q2.  We continue to believe equity and real-estate markets in China are over-valued and there is further to fall.
  10. In 2010, certain commodities are poised for a sharp sell-off.  Top of our lists for a correction are gold and oil. This call has produced a mixed result.  Gold is up over 13% through the end of Q2 while oil is down over 14% over the same period.  While gold remains a popular investment alternative to faltering currencies (Euro, USD), we believe its big run-up over the past few years puts it firmly into bubble territory.   We believe oil prices will remain depressed until the global economy is back on its feet.


[1] The Investment Company Institute, which tracks mutual fund flows

Coming to a head…

Coming to a head…

In our last few letters, we have discussed the extraordinary measures undertaken by governments across the world to support aggregate demand, and the extensive borrowing required to do this.  Over the past three months, both of these issues have been thrown into stark relief by events.

The dramatic and extremely sudden deterioration of Greek sovereign credit in the marketplace forced the European Central Bank (ECB) into a rapid about-face.  Germany’s elected representatives blinked and committed to a vast fund to support Mediterranean nations. Very few people expected to see the IMF lead a rescue package for European Monetary Union member-states in their life-times.  Eroding confidence in the ECB and EMU led to a deterioration in the value of the Euro as talk of this currency supplanting the US Dollar as the new global reserve currency did a sharp 180 degree turn and even sober commentators began to talk of a break-up of the European monetary union and the Euro’s death.  Meanwhile, bond-holders have turned their sights on the increasingly precarious state of sovereign balance sheets in most of the developed world.  Shocked by the speed with which Greek bonds lost value, most bond buyers are thinking seriously about sovereign credit risk in the developed world, awakening from a period that lasted two generations during which these risks were largely ignored.  Meanwhile, treasury officials the world over review the results of their bond auctions nervously, wary of any sign of demand slacking.  In many cases, their own central banks are becoming the most reliable buyers or financiers of new debt.

Three months ago, we wrote in an earlier post:

Numerous stimulus programs across the world will also be removed over the course of this year, including bank loan fueled infrastructure spending in China.  As the global economy has these crutches removed, we will watch with great interest to see how severe the damage to core private enterprise has been.

We believe this process has begun and the initial signs do not augur well for the global economy.  We have seen a debate re-kindled recently about whether the withdrawal of stimulus at this juncture is a repeat of “errors” made in the 1930s, when stimulus spending was reduced to control deficits.  However, with aggregate debt levels in the developed world as high as they are, we see few alternatives to a steady reduction of the extraordinary fiscal and monetary measures undertaken to control the crisis.

We also feel it’s necessary to discuss the “Flash Crash” of May 6th.  In our blog post the next day, we wrote that:

Since US equity market prices are far higher than underlying valuation (according to our measures) we were not surprised by the extent of the drop.  But we were very surprised by the speed at which the drop occurred, as well as the speed of the partial recovery.  It reminded us of the precipitous declines and partial reversals we saw during the height of the credit crisis in 2008 and 2009.   …

Though the US equity markets are receiving most of the attention, they are not the only source of the current volatility. Numerous other markets saw immense turbulence yesterday, including, but not limited to, overnight funding (libor), treasuries and particularly currency markets.  …

The major conclusions we draw from the trading action of the past week is that:

  1. Numerous market participants have limited conviction and their default stance is to step aside quickly in a falling market.
  2. The Euro-zone crisis will continue to roil markets until it is properly addressed.
  3. There are many underlying concerns about commodity prices, Chinese real-estate prices, credit-worthiness, etc. and they can manifest themselves very quickly.

Given the information we have, and our view of overall valuations, we caution investors to remain extremely vigilant and maintain a defensive posture.

All three major indices, Dow Jones Industrials, S&P 500 and Nasdaq composite closed out this quarter below the intraday lows reached that day.  The ten-year treasury is now below 3%, and no amount of commentary on US federal and municipal debt-levels appear to impact the decline.  Meanwhile, the Baltic Dry Index has dipped below 2500 again (amidst talk of expanding fleets and falling Chinese imports).  Speaking of China, we see more commentators openly questioning the solvency of Chinese banks and the reasons behind big IPOs.  All of this underpinned by the fact that unemployment and underemployment rates in western countries remain stubbornly high.

Not only is it increasingly difficult to write off the events of May 6th as a mere technicality, we believe that sudden decline has lead to deep distrust and uncertainty amongst investors.  Investors were already wary of fundamental economic and market conditions, the flash crash gave them reason to cast suspicion on the technical organization of the market.  This coupled with the SEC’s indictment of the premier US Bank, Goldman Sachs on charges of fraud, has fueled suspicion of large player’s motives and methods.  Many individual investors now believe the market is rigged against them, for the benefit of the largest trading firms and their most senior traders.  In our view, it was always thus.   Professional traders, whether they be electronic market-makers or specialists on the trading floor have always enjoyed a privileged position, which is completely appropriate given their role as liquidity providers and their responsibility to maintain orderly markets.  What we find difficult to accept is the extension of these privileges new players, without them being asked to shoulder the same responsibilities.

We do not see many silver linings amidst a climate of mutual suspicion and bad news.

EU’s version of shock and awe for bond vigilantes.

EU’s version of shock and awe for bond vigilantes.

A series of measures were announced today to provide support for troubled Euro-zone states.  The broad outline of the plan is that the European Union (EU) and the International Monetary Fund (IMF) are committing almost $1 trillion to support bond issues by Euro-zone states.  We see three reasons to question the initial market euphoria surrounding this announcement:

  • The immediate issue is that this measure, and its cost, will likely need be voted on by all member-state legislative bodies. There is a good chance it faces stiff opposition in at least one Euro-zone nation, potentially setting the stage for a political standoff reminiscent of the US congress’s initial vote on the TARP plan in September 2008.  The entire process will be controlled by member-states and the EU institutions have been largely bypassed.  The EU leadership has decided they want to sell this deal in 27 member-states simultaneously, with the markets breathing down their neck.  It is hard for us to believe they will find buyers in every member-state’s legislature.  Imagine if TARP had to be voted on by every US state legislature.  The UK government (after last week’s election, we aren’t sure who that is) has already decided it wants no part of the 440 billion euro loan guarantee program, others may follow upon reconsideration.  In any case, we suspect member-state legislators will not be as easy to corral as finance and prime ministers.
  • This announcement undermines the fiscal soundness of all European Union countries, especially if austerity measures are still resisted by the member states who are in very weak fiscal positions.  David Roche writes in the FT that “this deal is a form of contagion by official action”.
  • The German provincial election in Rhineland this past weekend did not go well for the Christian Democratic Union (CDU).  German voters handed Angela Merkel’s party an effective loss based on her support for a much smaller bail-out of Greece.  We do not believe German voters, or the constitutional court will be pleased about this announcement and the European Central Bank’s plan to purchase member-state debt.

A number of the fundamental issues raised as our generation’s financial crisis runs its course are summarized in an excellent Statfor piece titled The Global Crisis of Legitimacy.

In other news, Moody’s announced they may downgrade Greece to junk-bond status (S&P already has).   The European Central Bank (ECB) has announced they will buy these junk-rated bonds and the prevailing mood in Europe is to blame the rating agencies and banks for the debt woes of profligate member nations.  The ECB’s reputation for monetary stability and responsibility has been deeply compromised by this weekend’s announcement, and we fear it will be impossible to regain in the short-term.

The sovereign credit crisis in Europe is not over yet, and the questions surrounding the Euro have not been laid to rest.

Further reading:

  • Europe agrees rescue package
  • In a must-read analysis titled It’s not the way to solve Eurozone debt crisis, David Roche writes in the FT: “Initially, markets may be wowed by the size of the package. But the size just means that more debt has been added to a problem that is about too much debt! EU governments and the European Central Bank are now obliged to guarantee or buy the sovereign debt of other members as a solution to the Eurozone’s debt crisis. But the solution to a hangover is not more alcohol.”
Revisiting 2:45pm with Art Cashin

Revisiting 2:45pm with Art Cashin

One of the financial commentators we follow (for his trader’s eye view from the NYSE) is Art Cashin.  Art wrote today about the brief free-fall in stocks last Thursday afternoon.  To quote:

Nothing Sold For A Penny On The NYSE

There was a lot of discussion on the floor Friday about the huge air pocket that stocks hit on Thursday afternoon.

As the day wore on, skepticism began to grow about the “trader error” (fat finger) rumors that circulated late Thursday. There didn’t seem to be a telltale brief volume spike. Traders began to speculate that the trigger might have been a sudden spike in the Japanese yen which may have briefly panicked carry traders.

The other item was the finger-pointing among trading venues. Some competitors claimed the designed safety speed bumps in the NYSE hybrid system caused the air pocket. I may be a bit prejudiced but that borders on the ridiculous.

No $40 stocks traded at a penny on the NYSE. One trading venue, the Nasdaq canceled trades in 281 securities. David Kotok points out that 193 of them were ETFs. There are no ETFs listed on the NYSE floor. Therefore, they could not have been impacted by speed bumps. Further the NYSE canceled no trades.

It would appear that some trading venues may not be as deep and liquid as their marketing brochures imply.

To us this goes to show that investors must be aware of technical factors and market mechanics, since these sometimes create opportunity.  More importantly, however, understanding the mechanics of the market for our investments allows us to correctly analyse price action in a stress environment and avoid making bad decisions.

The collapse of 2:45pm and it’s broader implications.

The collapse of 2:45pm and it’s broader implications.

DominosLike most market participants, we watched the market moves yesterday afternoon with a certain degree of amazement.  Since US equity market prices are far higher than underlying valuation (according to our measures) we were not surprised by the extent of the drop.  But we were very surprised by the speed at which the drop occurred, as well as the speed of the partial recovery.  It reminded us of the precipitous declines and partial reversals we saw during the height of the credit crisis in 2008 and 2009.

While there have been some theories put forth to explain what happened yesterday, we do not have a definitive explanation for the rapid decline and subsequent recovery.  That said, we would like to share a few observations about yesterday’s trading and its broader implications:

  1. Equity markets were already down substantially (on the order of 3-4%) before the sudden drop occurred between 2:30 and 3:00pm. During their (brief) lows, the broad indexes were down over 9% before recovering.  We closed the day down 3-4% across the major indices.
  2. The sudden decline took us through multiple significant technical support levels. Volume was steady through the morning, picked up around noon and rocketed after 2:30.  Yesterday was the second highest-volume day on record.
  3. There were various (as yet unsubstantiated) rumors of “trader error” causing the decline. There have also been reports that many high-frequency trading operators stopped trading entirely since they hit internal limits which kick in under extreme conditions.
  4. Though the US equity markets are receiving most of the attention, they are not the only source of the current volatility. Numerous other markets saw immense turbulence yesterday, including, but not limited to, overnight funding (libor), treasuries and particularly currency markets.

The last point is the most significant for investors. There is a reasonable suspicion is that yesterday’s activity in the currency markets was part of an unwinding of the carry trade. Carry-traders are very sensitive to risk since they run large, leveraged positions which can be quickly wiped out. If this is correct, the events of this week were broadly similar to moves that occurred in August 2007, which affected quantitative hedge funds mostly, and marked the beginning of the declines of 2008 and 2009. See Andrew Lo’s paper, What happened to the quants in August 2007.

The technical reasons for the stock market decline are what have received the most scrutiny in the press. In our view, the steady surrender of volume and responsibility from trading floors (where participants meet market-makers face to face) to electronic exchanges with liquidity provided by automated high-frequency trading systems certainly exacerbated the sudden acceleration of the decline, but did not cause it.

Not-withstanding purely technical reasons affecting the speed and steepness of a 15 minute decline, the underlying reasons for increased risk-aversion are real. We also believe it betrays extremely short-term memory to claim that such sudden declines do not occur in a specialist managed market. We only need to point to Black Monday (October 19, 1987), when the market dropped 22% over the course of the day.  In 1987, most stock was traded via specialists on the physical floor of the NYSE.   In that instance, automated selling by “portfolio insurance” providers accelerated the decline.  Yesterday, the NYSE maintained a relatively orderly market, the extremely low-priced trades appear to have occurred on secondary exchanges with low liquidity where numerous market sell or stop loss orders may have encountered a limited number of bids and shallow order books.   In and of itself, this is not unusual, stocks always decline suddenly when there are a lot of sellers and no buyers.

This is an interesting debate, but in our view is largely irrelevant for investors.  One market commentator remarked:

For starters, let’s all keep in mind that these things don’t happen in a healthy tape. The jitters from Greek rioting and possible contagion were the necessary preconditions for a crash like that.

The major conclusions we draw from the trading action of the past week is that:

  1. Numerous market participants have limited conviction and their default stance is to step aside quickly in a falling market.
  2. The Euro-zone crisis will continue to roil markets until it is properly addressed.
  3. There are many underlying concerns about commodity prices, Chinese real-estate prices, credit-worthiness, etc. and they can manifest themselves very quickly.

Given the information we have, and our view of overall valuations, we caution investors to remain extremely vigilant and maintain a defensive posture.

Further reading:

Felix Salomon’s initial take: How a market crashes

Felix after taking a deep breath: Deconstructing the crash

Bloomberg’s Nina Mehta and Craig Nagi: Market fragmentation may get review after stock drop

The Euro-zone is like…

The Euro-zone is like…

Image of boats

For the past several months, we have been thinking about the broader Euro-zone’s economic malaise.   In the course of conversations, we sometimes use analogies, and we thought we’d share this one with our readers.

As part of the aim to integrate Europe and limit the future likelihood of war, European countries have sought to develop deep political links (by joining the European Union) and integrate their financial markets (by joining the shared currency regime).  As a result of this process, large, developed, stable economies in Europe (Germany, France etc.) have lashed themselves to smaller, relatively under-developed, unstable economies (Greece, Portugal, etc.).

Imagine each of these countries as boats on the open ocean.  Some of them are large, modern vessels carrying many passengers, while others are smaller, rickety affairs.  In creating the European Monetary Union, these countries sought to create a larger water-craft by roping together many different boats.  There are definitely advantages to doing this.  Passengers on the boats (citizens) can now easily trade and transact with those on other boats.

However, it takes generations for all passengers to develop a sense of common destiny and values.  The Eurozone has not had that much time, yet finds itself in the middle of a large storm.  The big problem is that there is no mechanism defined to detach the larger unit from a vessel that has begun to sink in a storm.

Passengers on the sound, stable sea-craft (German burghers) do not want to put themselves at risk by stepping onto the sinking ships to help bail water, yet their captains are calling for them to do so.  Meanwhile, the combined craft made of many mis-matched boats continues to tilt and take on more water.

To compound the problem, we saw a riot on one of the sinking boats yesterday.  Some passengers (Greek nationals) on that boat tried to set it (literally) on fire.  The rest of the world does not expect such things to happen in developed economies and looks on in disbelief.

What we find remarkable, is the speed with which assumptions have changed.  Nine short months ago, virtually everyone was calling the demise of the US dollar and the rise of the Euro as the new global reserve currency. Now we are at a point where the dissolution of the Euro is being openly debated.  Greek citizens riot in the streets because their elected representatives have chosen to call a halt to profligate policies and crack down on pervasive tax-dodging and fudging of statistics.  The rest of the world stares aghast. Meanwhiles, the rats (speculators) are deserting the ship.

For a less metaphorical take on the crisis, please read Edward Chancellor’s FT Opinion piece  Greece a bad omen for others in debt.