Q3 letter: The market can remain irrational…
We trust you’ve all had a pleasant summer. As we head into autumn, the question on every investor’s mind seems to be when the longest running bull market in US history will end. For several quarters, we’ve advocated caution based on our view that equity valuations continue to be unreasonably high. We have, however, always kept Keynes’ adage in mind, that “The market can remain irrational longer than you can remain solvent”. Keynes learned this valuable lesson through his own experience trading currencies and investing on behalf of the King’s College endowment from 1921-1946. Many things have changed in the investment world since Keynes coined that phrase, but economic cycles have not. And just as it was during Keynes’ time, all bull markets eventually come to an end (sometimes abruptly) and usually with a recession.
When assessing the health of the economy, there are several indicators investors and economists monitor to gauge whether the business cycle is approaching a recession. Let’s consider them one by one:
- Consumer Confidence Index: This index published by The Conference Board measures economic optimism of US consumers via their spending/savings activities. The Consumer Confidence Index dropped 9 points to 125 in September, with both consumers and businesses indicating conditions were not as good as they were earlier in the year, however levels are still fairly high. The same organization publishes a “CEO Confidence index” which also dropped 9 points to the lowest level in our decade long expansion, suggesting the corporate C-suite is showing more trepidation than consumers at the moment.
- Stock Prices: are considered a leading indicator of economic activity since valuations are based on future earnings. The S&P 500 reached an all time high in August (3007 points), we are now approx 4-5% below that high.
- Purchasing Managers Index: The Institute for Supply Management publishes an aggregate measure of the US manufacturing sector. This index dropped to 47.8% in September (from 49.1%). Any reading below 50 signals a contraction. A key measure of exports dropped to the lowest level (41%) seen in a decade. The corresponding measure for the services sector (the NMI) stands at 52.6%.
- Durable and manufactured goods orders: The US Census Bureau reported that durable goods orders increased by 0.2% in August, while shipments and inventories of durable goods rose marginally. New orders for manufactured goods dropped by 0.1% in August, shipments and inventories rose marginally.
- Housing starts: The Census Bureau also reported that building permits rose 7.7% in August (seasonally adjusted). New residential construction is at the highest level it has been since 2007 (but well below the highs of 2005). Some of this can be attributed to falling interest rates lowering the cost of capital.
- Weekly Hours: This measure estimates the number of paid hours worked by the hourly workforce. This indicator bottomed out at 33.7 hours in 2009, it reached a high of 34.6 hours in 2016. It is now close to that high, at 34.4.
- Global Trade: The WTO measures trade in goods and services across the world. Its most recent report indicates global trade in both goods and services has weakened in all regions this year. The softness is largely driven by unresolved trade disputes. The Global PMI stands at 47.5, which is the lowest level since 2012.
Taken in aggregate, consumer confidence (the most forward looking measure) and the PMI indicate some softness in the economy. Global trade activity is weakening, which is also a negative sign. Other indicators signal low to moderate growth. The services sector appears to be growing, with exports and manufacturing showing no growth or mild contraction.
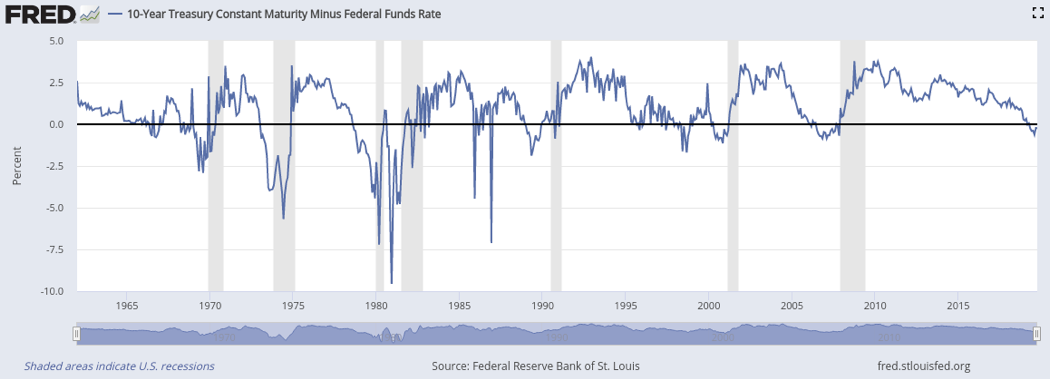
Interest Rates are also considered a leading indicator of economic activity. Lending for long periods of time carries greater risks than short term lending, and investors generally demand higher rates to lend for longer periods. When long term interest rates are higher than short-term rates, the “yield/rate curve” is considered to be normal. When long-term interest rates fall below short-term rates, it implies that bond investors believe rates will be lower in the medium-long term (i.e. the Fed will lower rates in response to a worsening economy). This is often called an “inverted yield curve”.
Many participants watch the “10 Yr – Fed Funds spread” to gauge the shape of the curve. This measures the difference between 10 Year interest rates and overnight Fed funds rates. When the overnight (1 day) interest rate is above the 10 Year rate, the spread is negative. The graph below shows a history of this rate spread. Every recession since 1960 (see shaded columns) has been preceded by a negative spread, i.e. an inverted yield curve.
Unemployment rates are the strongest single indicator that a recession has begun. Unemployment claims tend to rise almost exactly as the economy contracts. Businesses know it’s expensive to hire and train staff, so managers often wait to reduce headcount until they’re certain markets are shrinking. When large numbers of workers are laid off, they change their consumption behavior, spending less. This change in behavior can become “contagious” as neighbors and former colleagues of the unemployed also retrench, reducing their own consumption in the face of economic uncertainty. This feedback loop in turn deepens the recession.
Overall, we believe there are significant risks of a recession ahead. If the unemployment rate rises, and the stock market slides further, that should be seen as a confirmation that the economy has begun contracting. We would then recommend very defensive positioning in client portfolios.
Our current recommendation to investors is to maintain caution and vigilance, rebalancing portfolios to be defensive and be prepared to act if conditions deteriorate further.
Regards,
Subir Grewal, CFA, CFP Louis Berger